COUNTING THE COST OF UNDER-UTILIZED GPUS – AND DOING SOMETHING ABOUT IT
The compute engines keep changing as the decades pass, but the same old problems keep cropping up in slightly different form.
In both the traditional HPC simulation and modeling market and the adjacent AI market including machine learning and data analytics, the GPU has become the compute engine of choice because of the price/performance, memory bandwidth, and varied forms of calculation that it enables.
But here’s the rub: It is not always easy to keep these GPUs – usually ganged up in two, four, or eight inside of servers – busy.
More than a decade ago, we had a revolution in server virtualization, which let companies create virtual machines and gang up multiple server workloads onto a single physical server, driving CPU utilization from between 10 percent to 15 percent in a typical machine in the enterprise datacenter up to somewhere closer to 40 percent to 50 percent. And the irony is that we find that GPU utilization in hybrid systems today is generally very low. The anecdotal evidence suggests that GPU utilization in these systems – you guessed it – is hovering somewhere around 10 percent to 15 percent. And this time around, a server virtualization hypervisor can help in terms of allocating work to the GPUs, but it cannot pool them across servers any more than you can have an ESXi, KVM, or Xen hypervisor span multiple server nodes.
Considering that these GPUs generally offer an order of magnitude better performance on intense calculations compared to CPUs, this inefficiency has been tolerated even if it is not talked about much. Nobody tells the CEO or CFO that a supercomputer, which having impressive peak theoretical performance, is actually under-utilized. But anyone seeing such low GPU utilization – and indeed, anyone using FPGAs, AI chips or other kinds of accelerators will have the same issue – certainly wants to get more out of those devices because they are expensive to buy, they take up space, they burn lots of juice, and they give it all back off as heat.
In a post-Moore’s Law world, every joule of energy is precious, and during the coronavirus pandemic, so is every dollar.
And that is why composable disaggregated infrastructure, or CDI as many are starting to call it, is coming along at just the right time. With this approach, accelerators like GPUs are pooled into enclosures and not tied to specific servers and linked to multiple servers using a PCI-Express switch fabric, allowing for the devices to be disaggregated from the servers and then composed on the fly by a PCI-Express fabric controller. This is a bit different from the server virtualization wave, where a hypervisor carved up CPU, memory, and I/O resources so multiple whole platforms could run in a virtual machine. With CDI, the elements of the system – storage, network interfaces, and accelerators like GPUs – are broken free of the servers and pooled across those servers using a fabric.
GigaIO is one of the several upstarts who are making CDI a reality, and is making inroads at HPC centers that need to drive up the utilization of the GPUs in their systems. We profiled GigaIO’s FabreX PCI-Express CDI fabric back in October 2019, when it was based on PCI-Express 3.0 switching. In March of this year, we spoke to GigaIO as it was updating its switching infrastructure to PCI-Express 4.0, which doubles up the bandwidth, about how this extra bandwidth might be employed. And at our HPC Day event last November, we spoke again to GigaIO about how the HPC sector should be a leader in disaggregation and composability. There is plenty of detail in these stories about how GigaIO’s FabreX composable interconnect works, and if that is not enough, here is a primer that debunks some of the myths around composable disaggregated infrastructure. And if you really want to get into the feeds and speeds, here is a white paper that GigaIO put together with PCI-Express switch ASIC partner Microchip.
This CDI approach means a bunch of different things for acquiring and managing infrastructure. First of all, the ratios of CPUs and their cores, DRAM main memory, and GPUs is fairly static within a node. You can use a server virtualization hypervisor to alter those ratios a bit, but it is not the same thing as having them perfectly fluid across a PCI-Express fabric that spans three or four racks of gear – the practical limit of PCI-Express networking, as we have discussed in the past. Not only that, it means that CPUs and accelerators can be upgraded independently of one another, and a particularly important subset of that is companies can keep existing servers and have them talk to GPU enclosures over the fabric rather than having to buy new servers that can support banks of GPUs. This helps with server TCO as the life of servers can be extended. Even old servers with PCI-Express controllers can drive PCI-Express 4.0 accelerators if need be to stretch their lives, much as servers with 25 Gb/sec or 50 Gb/sec ports can – and often are – attached to 200 Gb/sec switch ports until they are upgraded.
The magnitude of the benefits of the CDI approach are specific to the use cases involved, and to help customers who can’t take the time or money to do a lengthy proof of concept – or who want to get a feel for how they can drive up utilization on their GPUs by disaggregating them from their servers before they do a proof of concept or acquisition – Niraj Mathur, vice president of product management at GigaIO, created a workload-based total cost of ownership calculator.
To get a sense of how disaggregating GPUs from servers and driving up utilization can save people money, we had Mathur walk through a typical scenario. But before we get into that scenario, we want to remind everyone this is a conceptual tool, not a budgeting tool. Like all models, it has simplifications and assumptions.
For the sake of this model, there are servers that only have CPUs and servers that have GPUs, and given what is commonplace today, the model assumes that companies will want to have eight GPUs per server. Whenever possible, applications that are CPU-only will not be scheduled on hybrid CPU-GPU nodes. The model also assumes that only a single job runs on any server that is not disaggregated and composed. (This is typically what happens in a cluster in the real world.) For the disaggregated GPUs, there are eight of them in an enclosure (again this is typical) and 2, 4, 6, or 8 of these can be allocated to any given server on the other side of the FabreX PCI-Express fabric. On the hybrid CPU-GPU systems as well as the CPU-only systems, the nodes are connected with either 100 Gb/sec EDR InfiniBand or 200 Gb/sec HDR InfiniBand from Mellanox (now Nvidia Networking).
For now, many workloads can be modeled in the GigaIO tool, but no workload spans multiple servers; it is one job per server. The job durations are randomized and the needed GPUs for workloads are randomized between 1 and 8. Over time, the model could evolve to take into account jobs that span multiple machines, as many AI workloads and some HPC workloads do. The number of hosts per JBOG is currently set at four, to reflect GigaIO’s latest PCI-Express 4.0 JBOG offering. As for the applications, there are jobs that need GPUs and jobs that don’t, and users get to set the minimum and maximum duration for each type of job, and the number of runs they want to do to get a statistical distribution.
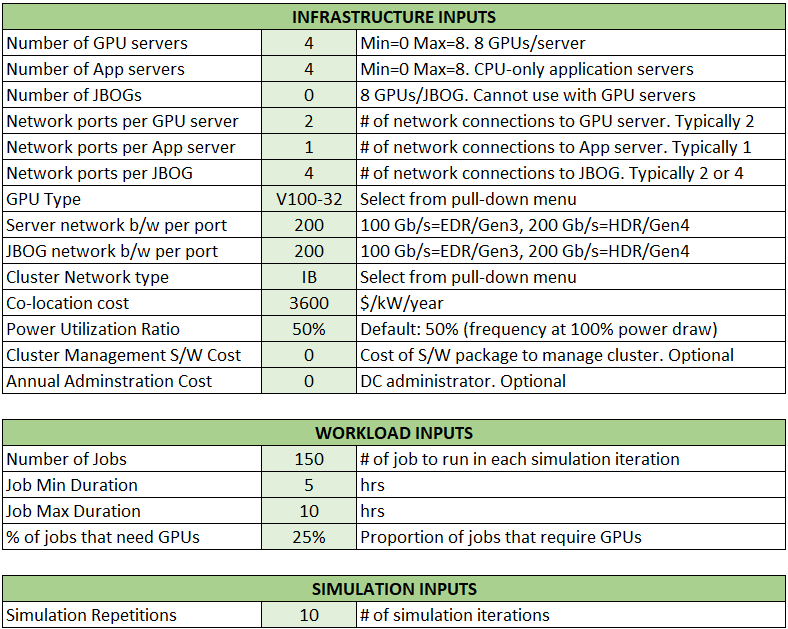
In the scenario that Mathur ran for us, here are what the inputs looked like for a cluster with four GPU servers equipped with eight of the 32 GB Nvidia V100 accelerators alongside four CPU-only servers:
The tool allows prospective buyers to input the annual cost of their administrator and of their cluster management software along with co-location costs for their datacenter. Users can set the number of jobs, in this case 150, the min and max duration of jobs, the percent of jobs that need GPUs, and the number of repetitions to get a statistical simulation sample. (This is a bit like predicting the weather with a simulation. Literally and figuratively.)
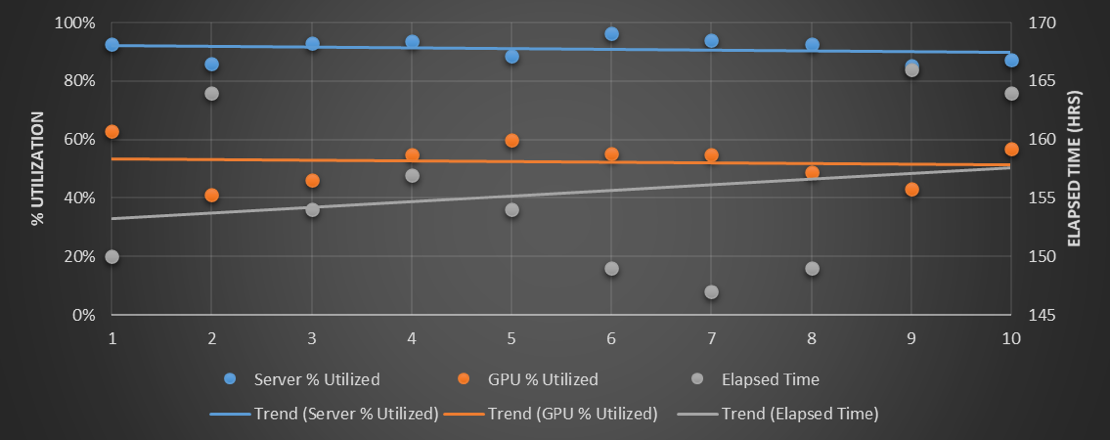
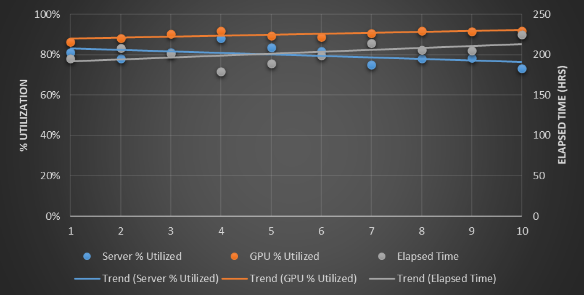
When you run the model for the InfiniBand network of machines where the GPUs are tied to the servers, with a total of 32 GPU accelerators, here is what the performance output looks like for the inputs given in the table above:
The lines are drawn to make the best fit for the ten different runs. So the CPUs are running pretty much at around 90 percent utilization here, but the GPUs are looking more like 50 percent. (Which is pretty good compared to the average out there in the real-world, apparently.) The elapsed time to run the 150 jobs is on the order of 155 hours, or 6.5 days.
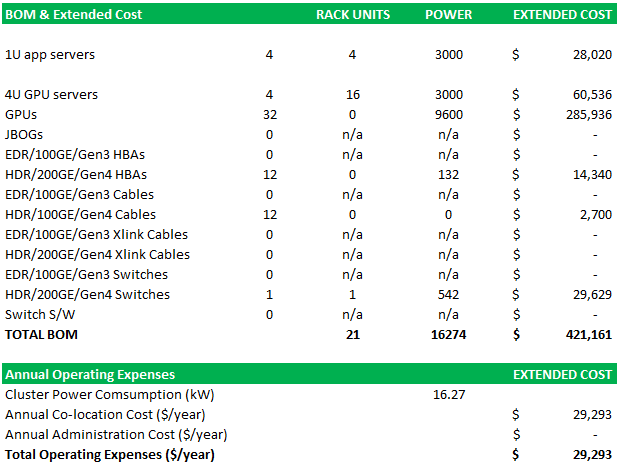
Now, here is the cost of those systems and networks:
The whole shebang costs $421,161 for the hardware and systems software and burns 15.94 kilowatts of juice. If you want to talk about colocation costs, those are shown as annual operating costs, and amount to $29,293. All told, you are in for $450,454.
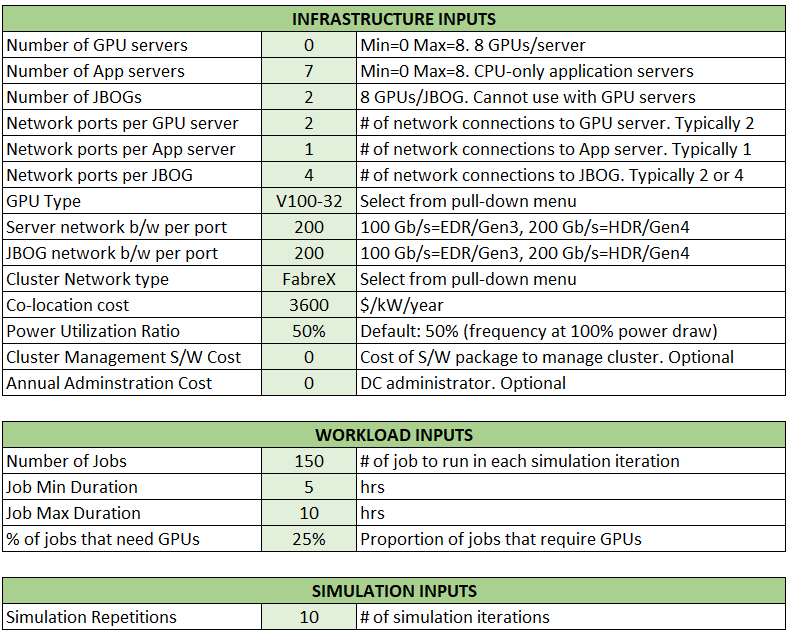
Now, let’s look at the disaggregated and composed GPU example to try to do the same work in roughly the same time. Here are the inputs for this scenario, which has two GPU enclosures with only half the number of GPUs – a total of eight – running across a total of only seven servers:
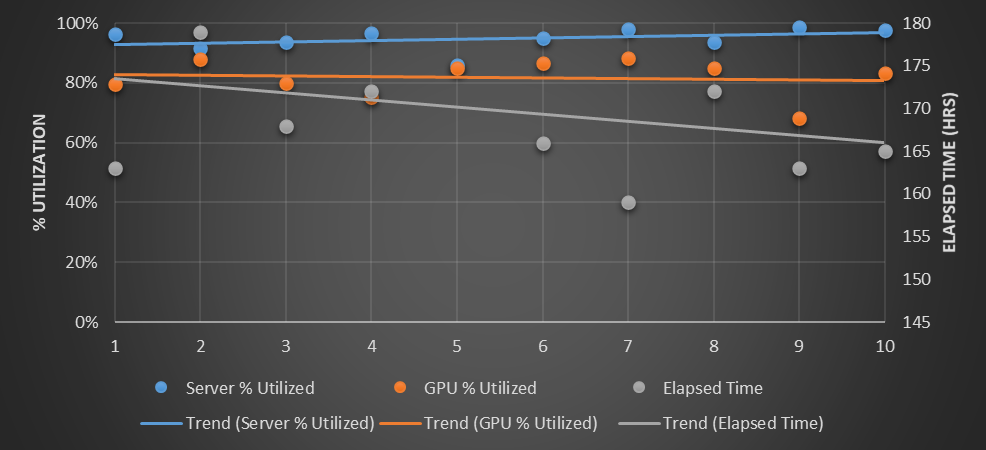
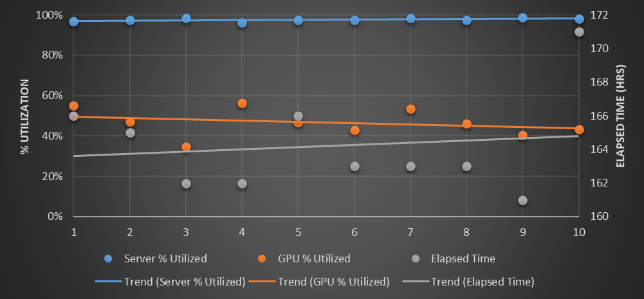
To reiterate, there is one fewer physical server and one half the number of Nvidia V100 GPUs. The seven servers are linked to each other and to the pair of JBOG enclosures using the FabreX disaggregation and composability software and PCI-Express switching. The number of jobs, the minimum and maximum duration of the jobs, and the mix of jobs that need GPUs is the same as in the first scenario. And here is what happens, and it is very interesting:
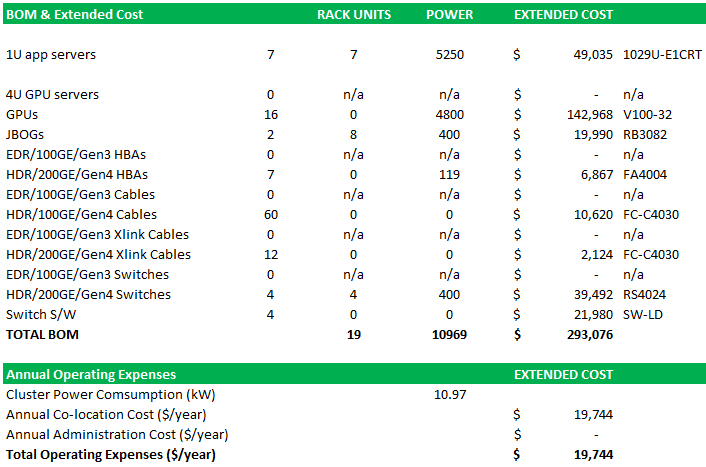
As you can see, there is a little bit more variability in the elapsed wall time for the 150 workloads to complete, and at 167.5 hours (just under seven days), the time it takes a little bit longer for them to run. (About 8 percent more as the lines averaging it out across the ten runs shows). The CPU utilization goes up by a few points, to somewhere around 97 percent, but look at that GPU utilization. It rises by 30 points to 80 percent. Clearly, sharing the GPU resource, even if it is half the number of GPUs, does not necessarily mean that the GPU work takes longer. It drives up utilization on the GPUs and – here’s the other fun bit – the costs go way down. Take a gander:
This setup only costs $293,096 to acquire, and it only burns 10.97 kilowatts. That is a 30.4 percent reduction in hardware costs and a 31.2 percent reduction in power consumed. (Funny how they fall at the same rate, more or less. It’s probably just a coincidence but a correlation.)
And now we can bring it all home with relative price/performance between the plain vanilla and CDI approaches. Let’s amortize that iron in both scenarios over three years and put a per-hour price tag on the two clusters. For scenario one, with no disaggregation and composition, it costs $16.01 per hour for the hardware, so those 155 hours of computation wall time to run the 150 workloads to completion costs $2,482. But for scenario two using FabreX to disaggregate the GPUs from the servers and then compose them on the fly, it only costs $11.14 per hour for the iron amortized over the three-year term, and that works out to a cost of $1,866 to complete the 150 workloads at the rates shown. That is a 25 percent improvement in bang for the buck. (The operational costs are not so dramatically different in these scenarios because people cost the same and the power and cooling savings are not a huge component of the price.)
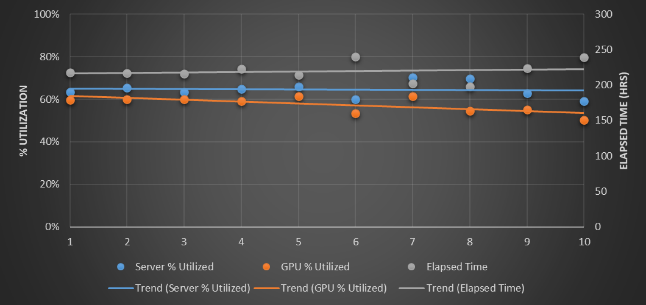
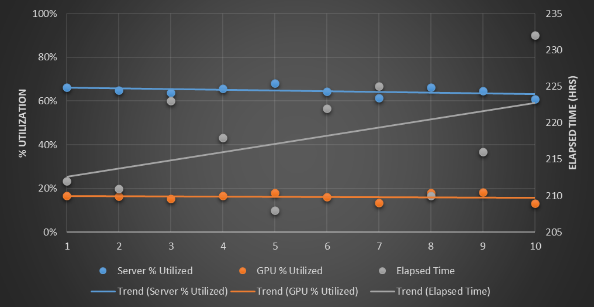
So, we know what you are thinking. How sensitive is this model, and therefore the value of CDI, to the relative percentage of jobs that need GPUs on these two scenarios? Well, let’s take a look, and in this case run the GPU server and InfiniBand-only scenario at 75 percent (more than the original scenario) and at 25 percent (less than the original scenario). Here is what it looks like:
For this scenario with a tweak to 75 percent of the workloads needing a GPU, the GPUs are under utilized and the total time to complete the workloads goes up north of 200 hours, and at only 25 percent of the workloads needing GPU processing, the GPUs are only around 20 percent utilized.
Now, switch to the FabreX CDI scenario and tweak the GPU load to 75 percent and 25 percent of the workloads:
With the 75 percent workload requirement for GPUs, the total time to complete the 150 workloads is nearly the same – again with one fewer server and half the number of Nvidia V100 GPUs – and with the 25 percent workload scenario, the FabreX setup runs in 163 hours compared to around 215 hours for the all-InfiniBand, GPU server setup.
So the bottom line of these simulations is you can spend less, and get more: less gear to get to time to result faster. And you get brownie points on the way for making your data center greener by using less power.
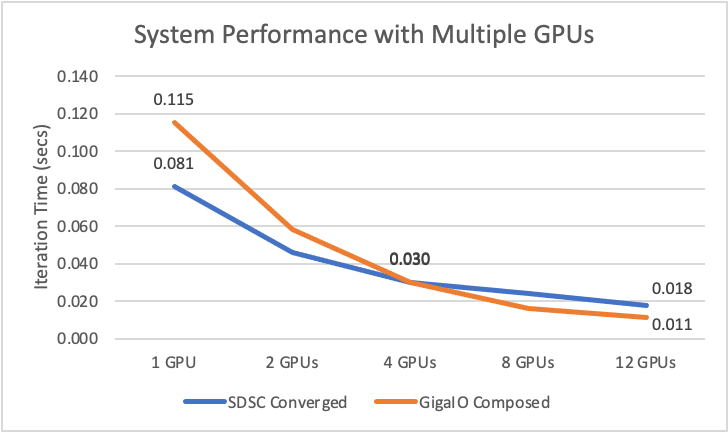
Now that we have looked at the theory: does this stuff deliver in real life? Turns out that’s exactly what SDSC set out to find out last year. As a leading supercomputer center, they were running a high performance and large-scale earthquake wave propagation simulation software on its Comet supercomputer, but wondering whether SDSC could save money running composed less expensive GPUs on FabreX. SDSC had Nvidia P100 GPUs at $6,500 a pop installed in Comet, and tested performance versus the inexpensive GeForce 1080TIs at $1,000 each, the latter composed over FabreX. Using the equivalent of GPUDirect, the test data show they could reduce their system cost from $210,000 to $70,000 and increase their performance by over 40 percent (per interaction) with 12 GPUs to boot.
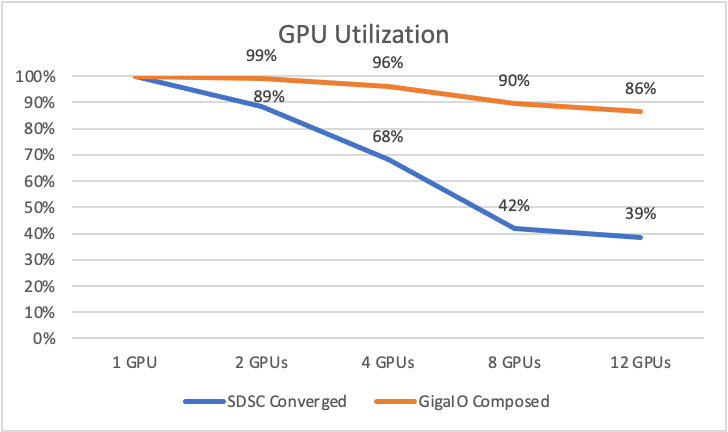
Here are the test results:
These real life results are all about the utilization rate modeled in the TCO simulator: the tests showed that while with one GPU performance was better with a $6,500 GPU versus a $1,000 GPU, when you use four GPUs, a step function improvement in utilization occurs (98 percent versus 62 percent) because the GPUs have to communicate over the UPI bridge in Comet, versus peer to peer (P2P) in FabreX. With 12 GPUs, Comet now uses InfiniBand to communicate between GPUs located in different servers, and utilization drops to 39 percent versus 82 percent with FabreX.
So, this test proves that you can use less performant GPUs or fewer of them and still get faster time to results with composable infrastructure. Whether you are interested in reducing your Capex or Opex, or in getting faster time to results with the same investment, you might want to give composable infrastructure a try.
